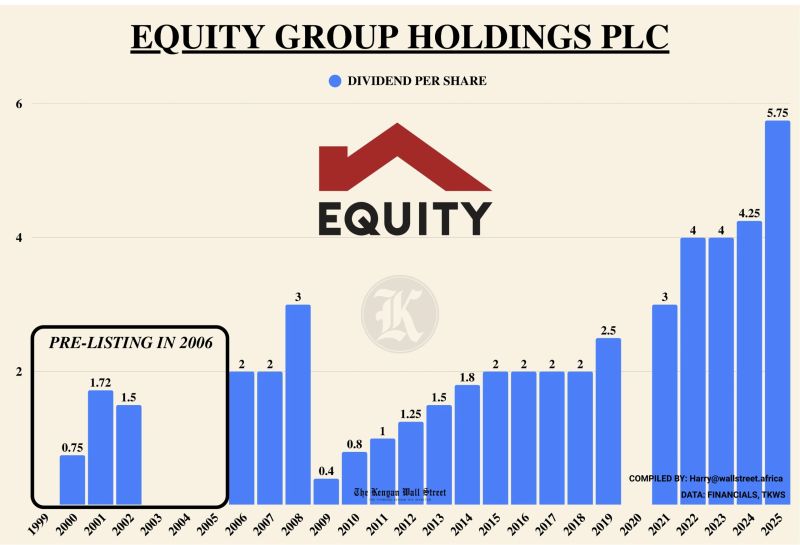
Here’s the dividend track record over the years:
- 2025: 5.75 (Final)
- 2024: 4.25 (Final)
- 2023: 4.00 (Final)
- 2022: 4.00 (Final)
- 2021: 3.00 (Final)
- 2020: 0.00
- 2019: 2.50 (Final)
- 2018: 2.00 (Final)
- 2017: 2.00 (Final)
- 2016: 2.00 (Final)
- 2015: 2.00 (Final)
- 2014: 1.80 (Final)
- 2013: 1.50 (Final)
- 2012: 1.25 (Final)
- 2011: 1.00 (Final)
- 2010: 0.80 (Final)
- 2009: 0.40 (Final)
- 2008: 3.00 (Final)
- 2007: 2.00 (Final)
- 2006: 2.00 (Final)
Observation:
Equity Group Holdings has a long history of paying dividends, with a clear upward trend in the last decade, except for 2020 when no dividend was paid (likely due to COVID-19 disruptions).
Question for investors:
Do you think this is a good company to hold solely for dividends, given its historical consistency and growth trajectory?
Source: Kenya Wall Street